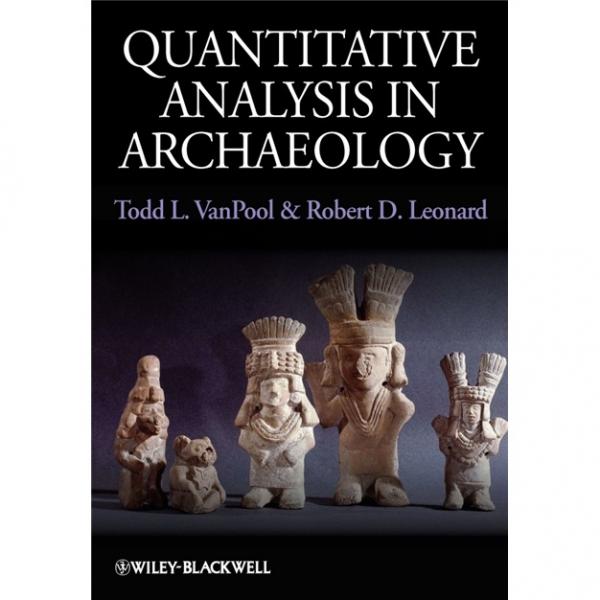
QuantitativeAnalysisinArchaeology
出版时间:
2010-11
ISBN:
9781405189507
定价:
405.40
装帧:
平装
-
Quantitative Analysis in Archaeology introduces the application of quantitative methods in archaeology. It outlines conceptual and statistical principles, illustrates their application, and provides problem sets for practice.? Discusses both methodological frameworks and quantitative methods of archaeological analysisPresents statistical material in a clear and straightforward manner ideal for students and professionals in the fieldIncludes illustrative problem sets and practice exercises in each chapter that reinforce practical application of quantitative analysis Todd L. VanPool is Assistant Professor at the Department of Anthropology, University of Missouri, Columbia.??? He is the co-author with Christine S. VanPool of Signs of the Casas Grandes Shamans (2007), Religion in the Prehispanic Southwest (2006) and Essential Tensions in Archaeological Method and Theory (2003).?Robert D. Leonard is retired from the Department of Anthropology, University of New Mexico, Albuquerque, where he taught for 17 years. He is currently the co-owner and a project director of Human Inquiry, a consulting firm that uses an interdisciplinary anthropological approach to help improve building designs. List of Tables. List of Figures. List of Equations. Acknowledgments. 1 Quantifying Archaeology. 2 Data. Scales of Measurement. Nominal level measurement. Ordinal level measurement. Interval level measurement. Ratio level measurement. The relationship among the scales of measurement. Validity. Accuracy and Precision. Populations and Samples. 3 Characterizing Data Visually. Frequency Distributions. Histograms. Stem and Leaf Diagrams. Ogives (Cumulative Frequency Distributions). Describing a Distribution. Bar Charts. Displaying Data like a Pro. Archaeology and Exploratory Data Analysis. 4 Characterizing Data Numerically: Descriptive Statistics. Measures of Central Tendency. Mean. Median. Mode. Which measure of location is best? Measures of Dispersion. Range. Interquartile range. Variance and standard deviation. Calculating Estimates of the Mean and Standard Deviation. Coefficients of Variation. Box Plots. Characterizing Nominal and Ordinal Scale Data. Index of dispersion for nominal data and the index of qualitative variation. 5 An Introduction to Probability. Theoretical Determinations of Probability. Empirical Determinations of Probability. Complex Events. Using Probability to Determine Likelihood. The Binomial Distribution. The psychic's trick. Simplifying the binomial. Probability in Archaeological Contexts. 6 Putting Statistics to Work: The Normal Distribution. 7 Hypothesis Testing I: An Introduction. Hypotheses of Interest. Formal Hypothesis Testing and the Null Hypothesis. Errors in Hypothesis Testing. 8 Hypothesis Testing II: Confi dence Limits, the t-Distribution, and One-Tailed Tests. Standard Error. Comparing Sample Means to m. Statistical Inference and Confidence Limits. The t-Distribution. Degrees of freedom and the t-distribution. Hypothesis Testing Using the t-Distribution. Testing One-Tailed Null Hypotheses. 9 Hypothesis Testing III: Power. Calculating. Statistical Power. Increasing the power of a test. Calculating Power: An Archaeological Example. Power Curves. Putting it all Together: A Final Overview of Hypothesis Testing. Steps to hypothesis testing. Evaluating common hypotheses. 10 Analysis of Variance and the F-Distribution. Model II ANOVA: Identifying the Impacts of Random Effects. Model I ANOVA: The Analysis of Treatment Effects. A Final Summary of Model I and Model II ANOVA. ANOVA Calculation Procedure. Identifying the Sources of Signifi cant Variation in Model I and Model II ANOVA. Comparing Variances. 11 Linear Regression and Multivariate Analysis. Constructing a Regression Equation. Evaluating the Statistical Significance of Regression. Using Regression Analysis to Predict Values. Placing confi dence intervals around the regression coefficient. Confidence Limits around Y for a Given Xi. Estimating X from Y. The Analysis of Residuals. Some Final Thoughts about Regression. Selecting the right regression model. Do not extrapolate beyond the boundaries of the observed data. Use the right methods when creating reverse predictions. Be aware of the assumptions for regression analysis. You may be able to transform your data to create a linear relationship from a curvilinear relationship. Use the right confi dence limits. 12 Correlation. Pearsons Product-Moment Correlation Coefficient. The assumptions of Pearson's product-moment correlation coeffi cient. Spearman's Rank Order Correlation Coeffi cient. Some Final Thoughts (and Warnings) about Correlation. 13 Analysis of Frequencies. Determining the Source of Variation in a Chi-Square Matrix. Assumptions of Chi-Square Analysis. The Analysis of Small Samples Using Fishers Exact Test and Yate's Continuity Correction. The Median Test. 14 An Abbreviated Introduction to Nonparametric and Multivariate Analysis. Nonparametric Tests Comparing Groups. Wilcoxon two-sample test. KruskalWallis nonparametric ANOVA. Multivariate Analysis and the Comparison of Means. A review of pertinent conceptual issues. Two-way ANOVA. Nested ANOVA. 15 Factor Analysis and Principal Component Analysis. Objectives of Principal Component and Factor Analysis. Designing the Principal Component/Factor Analysis. Assumptions and Conceptual Considerations of Factor Analysis. An Example of Factor Analysis. Factor Analysis vs. Principal Component Analysis. 16 Sampling, Research Designs, and the Archaeological Record. How to Select a Sample. How Big a Sample is Necessary? Some Concluding Thoughts. References. Appendix A Areas under a Standardized Normal Distribution. Appendix B Critical Values for the Student's t-Distribution. Appendix C Critical Values for the F-Distribution. Appendix D Critical Values for the Chi-Square Distribution. Appendix E Critical Values for the Wilcoxon Two-Sample U-Test. Index.
-
内容简介:
Quantitative Analysis in Archaeology introduces the application of quantitative methods in archaeology. It outlines conceptual and statistical principles, illustrates their application, and provides problem sets for practice.? Discusses both methodological frameworks and quantitative methods of archaeological analysisPresents statistical material in a clear and straightforward manner ideal for students and professionals in the fieldIncludes illustrative problem sets and practice exercises in each chapter that reinforce practical application of quantitative analysis
-
作者简介:
Todd L. VanPool is Assistant Professor at the Department of Anthropology, University of Missouri, Columbia.??? He is the co-author with Christine S. VanPool of Signs of the Casas Grandes Shamans (2007), Religion in the Prehispanic Southwest (2006) and Essential Tensions in Archaeological Method and Theory (2003).?Robert D. Leonard is retired from the Department of Anthropology, University of New Mexico, Albuquerque, where he taught for 17 years. He is currently the co-owner and a project director of Human Inquiry, a consulting firm that uses an interdisciplinary anthropological approach to help improve building designs.
-
目录:
List of Tables. List of Figures. List of Equations. Acknowledgments. 1 Quantifying Archaeology. 2 Data. Scales of Measurement. Nominal level measurement. Ordinal level measurement. Interval level measurement. Ratio level measurement. The relationship among the scales of measurement. Validity. Accuracy and Precision. Populations and Samples. 3 Characterizing Data Visually. Frequency Distributions. Histograms. Stem and Leaf Diagrams. Ogives (Cumulative Frequency Distributions). Describing a Distribution. Bar Charts. Displaying Data like a Pro. Archaeology and Exploratory Data Analysis. 4 Characterizing Data Numerically: Descriptive Statistics. Measures of Central Tendency. Mean. Median. Mode. Which measure of location is best? Measures of Dispersion. Range. Interquartile range. Variance and standard deviation. Calculating Estimates of the Mean and Standard Deviation. Coefficients of Variation. Box Plots. Characterizing Nominal and Ordinal Scale Data. Index of dispersion for nominal data and the index of qualitative variation. 5 An Introduction to Probability. Theoretical Determinations of Probability. Empirical Determinations of Probability. Complex Events. Using Probability to Determine Likelihood. The Binomial Distribution. The psychic's trick. Simplifying the binomial. Probability in Archaeological Contexts. 6 Putting Statistics to Work: The Normal Distribution. 7 Hypothesis Testing I: An Introduction. Hypotheses of Interest. Formal Hypothesis Testing and the Null Hypothesis. Errors in Hypothesis Testing. 8 Hypothesis Testing II: Confi dence Limits, the t-Distribution, and One-Tailed Tests. Standard Error. Comparing Sample Means to m. Statistical Inference and Confidence Limits. The t-Distribution. Degrees of freedom and the t-distribution. Hypothesis Testing Using the t-Distribution. Testing One-Tailed Null Hypotheses. 9 Hypothesis Testing III: Power. Calculating. Statistical Power. Increasing the power of a test. Calculating Power: An Archaeological Example. Power Curves. Putting it all Together: A Final Overview of Hypothesis Testing. Steps to hypothesis testing. Evaluating common hypotheses. 10 Analysis of Variance and the F-Distribution. Model II ANOVA: Identifying the Impacts of Random Effects. Model I ANOVA: The Analysis of Treatment Effects. A Final Summary of Model I and Model II ANOVA. ANOVA Calculation Procedure. Identifying the Sources of Signifi cant Variation in Model I and Model II ANOVA. Comparing Variances. 11 Linear Regression and Multivariate Analysis. Constructing a Regression Equation. Evaluating the Statistical Significance of Regression. Using Regression Analysis to Predict Values. Placing confi dence intervals around the regression coefficient. Confidence Limits around Y for a Given Xi. Estimating X from Y. The Analysis of Residuals. Some Final Thoughts about Regression. Selecting the right regression model. Do not extrapolate beyond the boundaries of the observed data. Use the right methods when creating reverse predictions. Be aware of the assumptions for regression analysis. You may be able to transform your data to create a linear relationship from a curvilinear relationship. Use the right confi dence limits. 12 Correlation. Pearsons Product-Moment Correlation Coefficient. The assumptions of Pearson's product-moment correlation coeffi cient. Spearman's Rank Order Correlation Coeffi cient. Some Final Thoughts (and Warnings) about Correlation. 13 Analysis of Frequencies. Determining the Source of Variation in a Chi-Square Matrix. Assumptions of Chi-Square Analysis. The Analysis of Small Samples Using Fishers Exact Test and Yate's Continuity Correction. The Median Test. 14 An Abbreviated Introduction to Nonparametric and Multivariate Analysis. Nonparametric Tests Comparing Groups. Wilcoxon two-sample test. KruskalWallis nonparametric ANOVA. Multivariate Analysis and the Comparison of Means. A review of pertinent conceptual issues. Two-way ANOVA. Nested ANOVA. 15 Factor Analysis and Principal Component Analysis. Objectives of Principal Component and Factor Analysis. Designing the Principal Component/Factor Analysis. Assumptions and Conceptual Considerations of Factor Analysis. An Example of Factor Analysis. Factor Analysis vs. Principal Component Analysis. 16 Sampling, Research Designs, and the Archaeological Record. How to Select a Sample. How Big a Sample is Necessary? Some Concluding Thoughts. References. Appendix A Areas under a Standardized Normal Distribution. Appendix B Critical Values for the Student's t-Distribution. Appendix C Critical Values for the F-Distribution. Appendix D Critical Values for the Chi-Square Distribution. Appendix E Critical Values for the Wilcoxon Two-Sample U-Test. Index.
查看详情

 占位居中
占位居中


